Does Using Social Media Make You More Likely To Be in a Car Accident?
Does Using Social Media Make You More Likely To Be in a Car Accident?

We’ve all seen it, or even done it ourselves… driving while using your phone. Is texting really the only problem, or does using social media make you more likely to be in a car accident?
We dug into the data and correlated use of Facebook, Twitter, Instagram, Snapchat, WhatsApp, LinkedIn, Youtube, and even audio and e-book consumption to likeliness to be involved in a car accident. While it may be obvious that, yes, using social media can increase you chances of being in a car accident, which social media platform makes you MOST likely?
About this study
The goal of the analysis is to assess the characteristics of the people who are involved in accidents and compare their characteristics to the general population. This way, we can correlate the impact of social media and technology on the chances of being involved in an accident.
Using sets of data collected from NHTSA’s FARS (Fatality Analysis Reporting System) and Pew Research Center’s Core Trend Survey, we were able to calculate the characteristics below. (Sources: Pew Research pdf, injuries.xlsx, social-media.xlsx)
Who is covered?
These statistics cover only the people of ages 18 and above and are vehicle drivers when the accidents happened no matter the type of injury.
Disclaimer – Correlation does not equate to causality. It simply suggests that there is a common factor that affects the two correlated variables.
Findings
Note – People who are involved in accidents refer to drivers only. In our case, we will only consider disproportions of >= 3% as significant.
Internet Use
- There is a 3.87% disproportion of internet users between Drivers Involved in Accidents and the overall population.
- There is a 3.38% disproportion of constant internet users between Drivers Involved in Accidents and the overall population.
- There is a 6.32% disproportion of users who connect to the internet several times a day. 6.32% is a major disproportion, suggesting that too much internet improves the chances of being involved in an accident.
- The data suggests that moderate internet use help reduce the chances of being involved in an accident. However, too much internet use increases the chance of being involved in accidents.
- There’s no way to figure out the exact reason for these disproportions, but here are some of the possible explanations:
- Internet users have access to live road conditions, weather conditions, traffic regulations, and even safety tips.
- Too much internet can take away a person’s focus, hence improving the chances of accidents.
- Internet use can lead to distracted driving. Given the fact that 9% of accidents in 2016 involved distracted driving, this is a likely possibility.
- Too much internet use can also mean too much exposure to devices that emit blue lights. Thus, it leads to wearing out the eye and therefore possible accidents.
- There’s no way to figure out the exact reason for these disproportions, but here are some of the possible explanations:
| Characteristic | Drivers Involved in Accidents | Overall Population | Disproportion (Ratio) | Disproportion (Difference) |
|---|---|---|---|---|
| Uses internet | 81.6% | 85.5% | -5% | -3.9% |
| Access internet on mobile | 83.0% | 83.3% | 0% | -0.3% |
| Constant internet | 29.5% | 26.1% | 13% | 3.4% |
| Connects to the internet once a day | 7.8% | 7.6% | 3% | 0.2% |
| Connects to the internet several times a day | 49.9% | 43.6% | 15% | 6.3% |
| Connects to the internet several times a week | 6.8% | 7.6% | -10% | -0.8% |
| Connects to the internet less often | 5.8% | 5.3% | 10% | 0.5% |
| Uses social media sites | 68.2% | 69.2% | -1% | -1% |

We’ve all seen it, or even done it ourselves… driving while using your phone. Is texting really the only problem, or does using social media make you more likely to be in a car accident?
We dug into the data and correlated use of Facebook, Twitter, Instagram, Snapchat, WhatsApp, LinkedIn, Youtube, and even audio and e-book consumption to likeliness to be involved in a car accident. While it may be obvious that, yes, using social media can increase you chances of being in a car accident, which social media platform makes you MOST likely?
Gaming Console
There is no significant disproportion in terms of console ownership, suggesting that console gaming does not impact the chances of accidents. Unfortunately, there are no available sets of data to assess if binge-gaming affects the chances of accidents.
| Characteristic | Drivers Involved in Accidents | Overall Population | Disproportion (Ratio) | Disproportion (Difference) |
|---|---|---|---|---|
| Owns a gaming console | 39.2% | 39.1% | 0% | 0.2% |

Social Media
- There are no significant disproportions in the social media user population of the people involved and accidents and the overall population. This proportion stays true across all social media platforms except WhatsApp. Thus, the data suggests that specific social media platforms are not as impactful as internet use in general.
- There is a 5.65% disproportion for WhatsApp users. This is a significant proportion and it implies that people who use WhatsApp are less likely to be involved in accidents especially when you compare it to other social media platforms. This is one of the most odd results we have. It may have resulted from demographic differences, but it is also worth taking note that there exists WhatsApp groups that send road condition news and warnings.
| Characteristic | Drivers Involved in Accidents | Overall Population | Disproportion (Ratio) | Disproportion (Difference) |
|---|---|---|---|---|
| Uses Facebook | 67.6% | 68.3% | -1% | -0.7% |
| Uses Facebook several times a day | 52% | 51.2% | 2% | 0.9% |
| Uses Facebook about once a day | 22.9% | 22.9% | 0% | 0% |
| Uses Facebook a few times a week | 15.4% | 16.6% | -7% | -1.2% |
| Uses Facebook every few weeks | 4.8% | 4% | 22% | 0.9% |
| Uses Facebook Less often | 4.8% | 5.2% | -8% | -0.4% |

| Characteristic | Drivers Involved in Accidents | Overall Population | Disproportion (Ratio) | Disproportion (Difference) |
|---|---|---|---|---|
| Uses Twitter | 24.4% | 23.8% | 3% | 0.6% |
| Uses Twitter daily | 46.7% | 46.6% | 0% | 0.1% |
| Uses Twitter several times a day | 28.7% | 27.3% | 5% | 1.3% |
| Uses Twitter about once a day | 18% | 19.2% | -6% | -1.3% |
| Uses Twitter a few times a week | 26% | 25.4% | 2% | 0.6% |
| Uses Twitter every few weeks | 14.6% | 13.5% | 8% | 1.1% |
| Uses Twitter less often | 13.6% | 14% | -3% | -0.4% |

| Characteristic | Drivers Involved in Accidents | Overall Population | Disproportion (Ratio) | Disproportion (Difference) |
|---|---|---|---|---|
| Uses Instagram | 34.3% | 34.9% | -2% | -0.6% |
| Uses Instagram several times a day | 36.9% | 38.9% | -5% | -2% |
| Uses Instagram about once a day | 21.1% | 21.0% | 0% | 0.1% |
| Uses Instagram a few times a week | 23.2% | 22% | 5% | 1.2% |
| Uses Instagram every few weeks | 9.6% | 8.8% | 9% | 0.8% |
| Uses Instagram less often | 8.4% | 9.1% | -7% | -0.7% |

Snapchat
| Characteristic | Drivers Involved in Accidents | Overall Population | Disproportion (Ratio) | Disproportion (Difference) |
|---|---|---|---|---|
| Uses Snapchat | 26.5% | 27.1% | -2% | -0.6% |
| Uses Snapchat several times a day | 46.7% | 48.2% | -3% | -1.6% |
| Uses Snapchat about once a day | 15% | 15.2% | -2% | -0.2% |
| Uses Snapchat a few times a week | 22.8% | 20.9% | 9% | 2% |
| Uses Snapchat every few weeks | 7% | 5.9% | 19% | 1.1% |
| Uses Snapchat less often | 9.4% | 9.2% | 2% | 0.2% |

| Characteristic | Drivers Involved in Accidents | Overall Population | Disproportion (Ratio) | Disproportion (Difference) |
|---|---|---|---|---|
| Uses WhatsApp | 15.5% | 21.1% | -27% | -5.7% |

| Characteristic | Drivers Involved in Accidents | Overall Population | Disproportion (Ratio) | Disproportion (Difference) |
|---|---|---|---|---|
| Uses LinkedIn | 26.4% | 24.2% | 9% | 2.3% |

Youtube
| Characteristic | Drivers Involved in Accidents | Overall Population | Disproportion (Ratio) | Disproportion (Difference) |
|---|---|---|---|---|
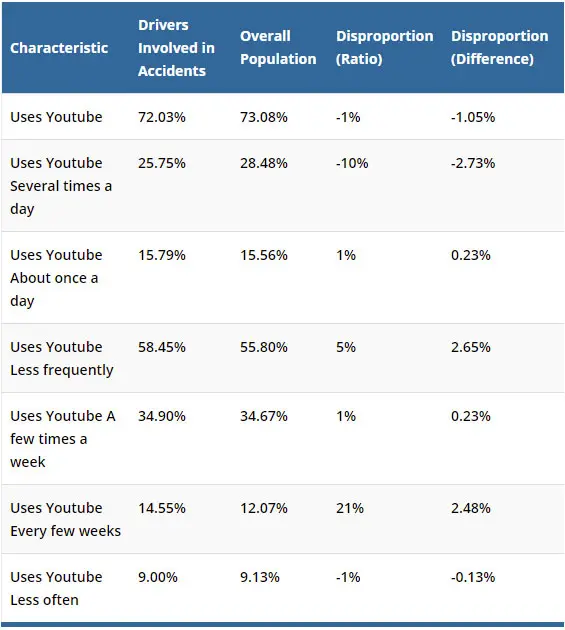
| Uses Youtube | 72% | 73.1% | -1% | -1.05% |
| Uses Youtube several times a day | 25.8% | 28.5% | -10% | -2.7% |
| Uses Youtube about once a day | 15.8% | 15.6% | 1% | 0.2% |
| Uses Youtube less frequently | 58.5% | 55.8% | 5% | 2.7% |
| Uses Youtube a few times a week | 34.9% | 34.7% | 1% | 0.2% |
| Uses Youtube every few weeks | 14.6% | 12.2% | 21% | 2.5% |
| Uses Youtube less often | 9% | 9.1% | -1% | -0.1% |

Books
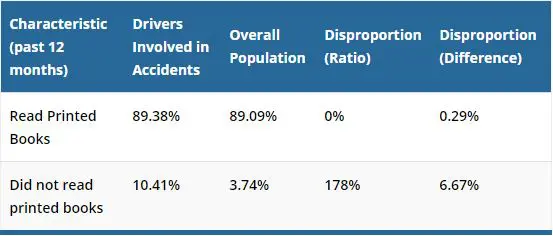
- There is a 6.67% disproportion in terms of people who did not read books in the past 12 months. This is a huge disproportion and it suggests that people who do not read printed books are more likely to be involved in accidents.
- Reading too many books (including printed, audio, and E-books) can possibly lead to accidents.
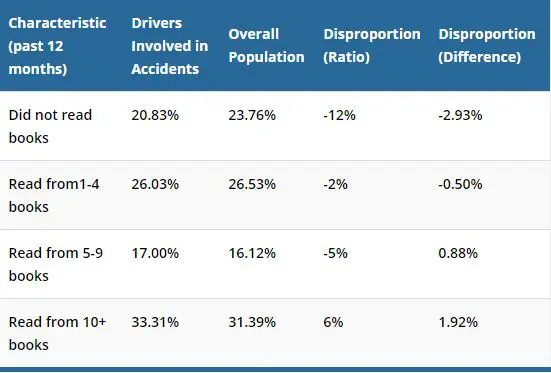
- Although there are no significant disproportions in terms of the book reader population, we can notice that the more books are read, the higher the disproportion (starting at -2.93% for people who did not read books)
- It is impossible to determine the exact nature of these slight disproportions. Because they are not significant, it is possible that they are mere coincidence.
- It is possible that books are as distracting as the use of the internet, hence the correlation between the number of books read and accidents.
- Another possibility is the eye strain caused by binge-reading walls of fine print text.
- Although there are no significant disproportions in terms of the book reader population, we can notice that the more books are read, the higher the disproportion (starting at -2.93% for people who did not read books)
| Characteristic (past 12 months) | Drivers Involved in Accidents | Overall Population | Disproportion (Ratio) | Disproportion (Difference) |
|---|---|---|---|---|
| Did not read books | 20.8% | 23.8% | -12% | -2.9% |
| Read from1-4 books | 26% | 26.5% | -2% | -0.5% |
| Read from 5-9 books | 17% | 16.1% | -5% | 0.9% |
| Read from 10+ books | 33.3% | 31.4% | 6% | 1.9% |

Printed Books
| Characteristic (past 12 months) | Drivers Involved in Accidents | Overall Population | Disproportion (Ratio) | Disproportion (Difference) |
|---|---|---|---|---|
| Read printed books | 89.4% | 89.1% | 0% | 0.3% |
| Did not read printed books | 10.4% | 3.7% | 178% | 6.7% |

Audio Books
| Characteristic | Drivers Involved in Accidents | Overall Population | Disproportion (Ratio) | Disproportion (Difference) |
|---|---|---|---|---|
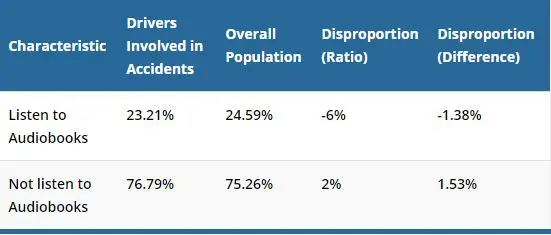
| Listened to audiobooks | 23.2% | 24.6% | -6% | -1.4% |
| Did not listen to audiobooks | 76.8% | 75.3% | 2% | 1.5% |

E-Books
| Characteristic | Drivers Involved in Accidents | Overall Population | Disproportion (Ratio) | Disproportion (Difference) |
|---|---|---|---|---|
| Read E-books | 33.4% | 33.5% | 0% | -0.1% |
| Did not read E-books | 65.6% | 65.9% | 0% | -0.3% |

Conclusion
| More likely to be involved in an Accident | Disproportion |
|---|---|
| Connects to the internet several times a day | 6.3% |
| Constantly connected to the internet | 3.4% |
| Did not read printed books in the past 12 months | 6.7% |
| Less likely to be involved in an Accident | Disproportion |
|---|---|
| Internet users in general | -3.9% |
| Uses WhatsApp | -5.7% |
Although some of the stats above suggest that the use of social media helps mitigate accident risks, these stats are of little significance (<3% disproportion). We also want to reiterate that the stats above do not signify causality. The -3.9% disproportion does not mean that a magical force beyond our comprehension saved internet users from accidents. Instead, it means that there’s a combination of factors that all contribute to the 3.9% disproportion. This includes demographic characteristics like level of education and individual-specific characteristics like access to traffic information.
Our Advice
- The internet is your friend – feel free to use the internet to access traffic and road information. In fact, we suggest that you make it a habit to check the internet for road condition updates before you drive especially if the weather is harsh.
- Avoid using devices while driving – while useful apps like Waze and Google Maps can help you navigate better, entertainment apps like social media platforms can take your attention away. Even if you are stuck in a traffic jam, avoid using your device and remain alert. After all, 9% of all road accidents resulted from distracted driving.
- Avoid too much use of devices before driving – constant internet users are more likely to have a higher screen time. Thus, they are more likely to have eye fatigue and therefore more road accidents.
- Too many books can be bad as well – fine-prints can cause eye fatigue and therefore hamper your driving. If you are a bookworm who can finish an entire book in a day, we suggest that you refrain from binge-reading.
- Join WhatsApp traffic news groups – this way, you’ll have access to localized road condition warnings.
In a nutshell, it’s all a matter of keeping your head filled with information and not distraction. If used right, social media platforms can become outlets of valuable road condition warning. On the contrary, using them at the wrong time can land you straight to the hospital.
